It’s Halloween, the busiest time of year for neighbourhood foot traffic.
So just how many trick-or-treaters can you expect? Obviously, it depends on how big of a treat you give out (everybody remembers the house that gives out regular sized candy bars).
But other than that, the best tool for the job is the Trick-or-Treat Onslaught at CensusMapper.ca.
Read More: The Fernwood Halloween bonfire is back
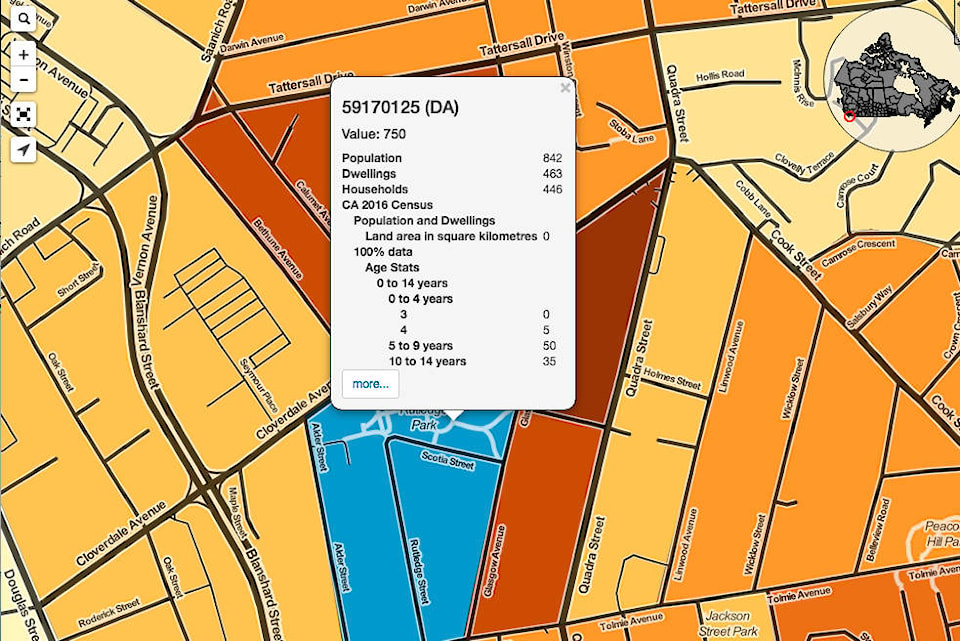
Made by a pair of GIS spatial academics Alejandro Cervantes and Jens von Bergmann, CensusMapper.ca taps into Canada’s 2016 census data to generate the Trick-or-Treat Onslaught, which calculates the number of trick-or-treat aged children per square kilometre.
The app marks children aged three through 14 as being of trick-or-treat age, and in Greater Victoria the densest neighbourhoods for trick-or-treating include the Colquitz, Glanford and Gordon Head areas of Saanich, as well as Vic West and the Camosun Jubilee area of Saanich-Oak Bay.
Similar information is available for communities across the Island.
CensusMapper.ca also provides a suggestive Trick-or-Treat density map to find the best trick-or-treating neighbourhoods and also has a Canada haunted houses app that gauges “dwellings not occupied by usual residents.”